2018 Overview
In 2018, total commitments for African infrastructure amounted to $100.8bn, an increase of 24% over the total commitments reported for 2017 and an increase of 33% over the 2015-2017 average. This is the first time that the level of commitments has passed the $100bn mark.
Who is financing Africa’s Infrastructure?
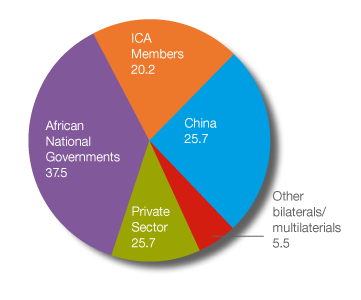
African governments were the largest source of infrastructure financing, with commitments of $37.5bn (37% of total commitments), followed by China who committed $25.7bn (25%), ICA members ($20.2bn, 20%), the private sector ($11.8bn, 12%), and other sources ($5.6bn, 6%).
Close to half ($9.5bn) of the $19.2bn increase observed in 2018 results from the inclusion, for the first time, of stand-alone commitments made by the private sector, particularly in the ICT and energy sectors. In previous years, commitments by the private sector were only gathered in the context of PPPs. The remainder of the increase comes mostly from higher commitments by China ($6.3bn) and African governments ($3.2bn).
ICA members committed $20.2bn*, an increase over the $19.4bn average of the three previous years. They also played important roles in institutional and policy reform. ICA member funding for energy operations amounted to $10.2bn, close to half of total commitments, establishing the energy sector as the sector receiving the largest share of ICA member financing in the 2014-2018 period, with the exception of 2017, when the transport sector had received the largest share of financing. The $3.9bn financing for the transport sector was 40% lower than the $6.6bn average for 2015-2017. The financing of $5.1bn in the water and sanitation sector in 2018 represents around 25% of total commitments, in line with its share in 2016 and 2017. The ICT sector accounted for $503m in commitments and multi-sector operations for $527m. As in previous years, WBG and AfDB were the biggest contributors, providing 62% of ICA member financing in 2018. West Africa, received the largest share of total 2018 commitments (30%, $6bn), followed by East Africa (18%, $3.7bn), North Africa (17%, $3.5bn), Central Africa (10%, $2.1bn), RSA (8% $1.7bn), and Southern Africa (excluding RSA) (6%, $1.2bn). Commitments to multi-regional operations accounted for 10% ($2bn) of total ICA commitments.
* This amount does not include commitments by the EC and the UK. For reference, the EC has historically committed over $1bn on average per year in the 2012-2016 period. The UK had committed $623m in 2017 and $569m in 2016 and has indicated that they expected their 2018 commitments to be
in line with their 2017 commitments.
The big picture 2018
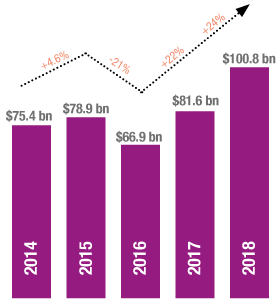
Total funding reached $100.8bn
Funding increased by
24%
Where the funding came from
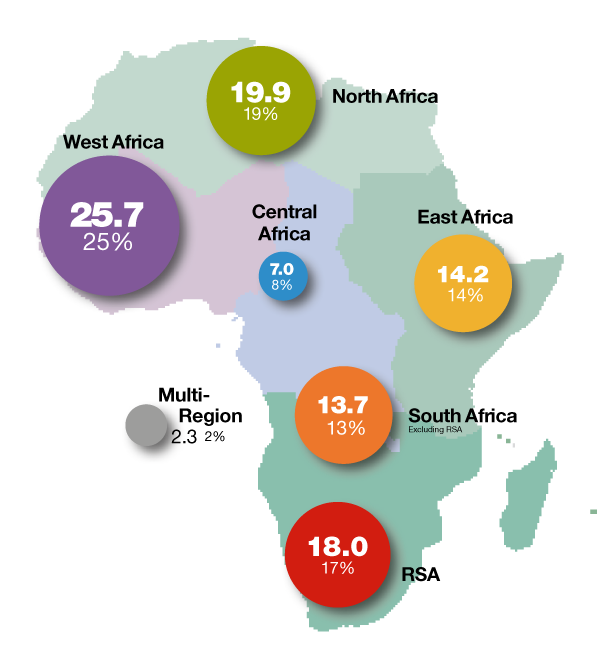
Funding distribution by region
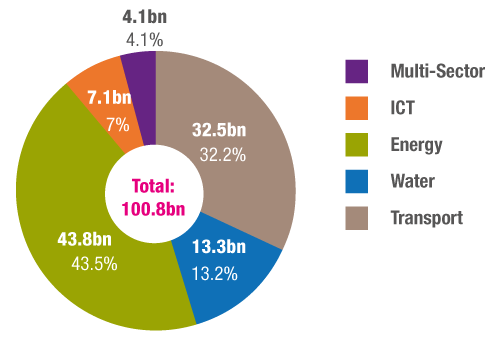
Funding distribution by sector
Key findings from the 2018 report include:
ICA members have continued to play a major role in financing Africa’s infrastructure. Over the past 5 years their support has remained at the high level of about $20bn per year. ICA members have also played important roles in institutional and policy reform in Africa.
The main sources of the large increase in the 2018 commitments are: African governments commitments rose to a level 33% higher than the three year average of 2015-2017; commitments by China increased by 65% over the previous 3-year average; and for the first time, commitments from Africa50, AIIB, IFAD, and self-standing private sector financing in ICT are included.
All sectors were the recipients of increased commitments, some more markedly than others:
- Transport sector 2018 commitments of $32.5bn were 5% higher than the 3-year (2015-2017) average of almost $31bn.
- Water and sanitation sector commitments, at $13.3bn, were 21% above the previous 3-year average of $11bn.
- Energy sector commitments in 2018 amounted to $43.8bn, 67% higher than the 2015-2017 average. This is the largest level of commitments ever recorded in the sector.
- ICT also saw record commitments in 2018, $7.1bn.**
Estimates of Africa’s financing requirements range from $130bn to $170bn.*** Even with the significant increase in 2018, which results in an average level of commitments of slightly above $83bn for the 2016- 2018 period, there remains a financing gap of $53bn to $93bn per year.
** Total private plus public sector commitments prior to 2018 are not known, because of a change in methodology that now includes selfstanding private sector financing.
*** African Economic Outlook 2019.
